Viewing the Data in Reports
How to view data in Tempo reports
Important
Viewing worklogs for your team members in Tempo Reports requires the View Worklogs and Browse Projects permissions. To see worklogs for other users in a project, you need to have the View All Worklogs permission.
To report on planned time, you need to have Tempo Planner installed. Viewing plans requires the View Plans permission.
You can view the worklog data from inactive or deleted Jira users in a report - see Inactive or Deleted Jira Users and Tempo Timesheets for more information.
In addition to filtering, grouping and sorting, you can customize Tempo reports with specific views, charts and columns in order to show your data in a meaningful manner. This includes an overview format which provides a high-level look at the data, as well as more nuanced views which organize your data by days, weeks, months, or quarters and present it in greater detail. To further customize your reports, you can add charts to your reports so you and others can understand the report's contents at a glance, as well as add columns to show a variety of Jira fields and work attributes. Finally, you can easily adjust the way that dates and times are displayed to suit your preferences.
Tempo remembers all your view settings and preferences between sessions.
Select Reports
 in the Tempo sidebar to create or open a saved report.
Switching between Views
To switch between views, click the Overview button at the top-right, and then select either Overview, Days, Weeks, Months or Quarters. The button's label shows the currently selected view.
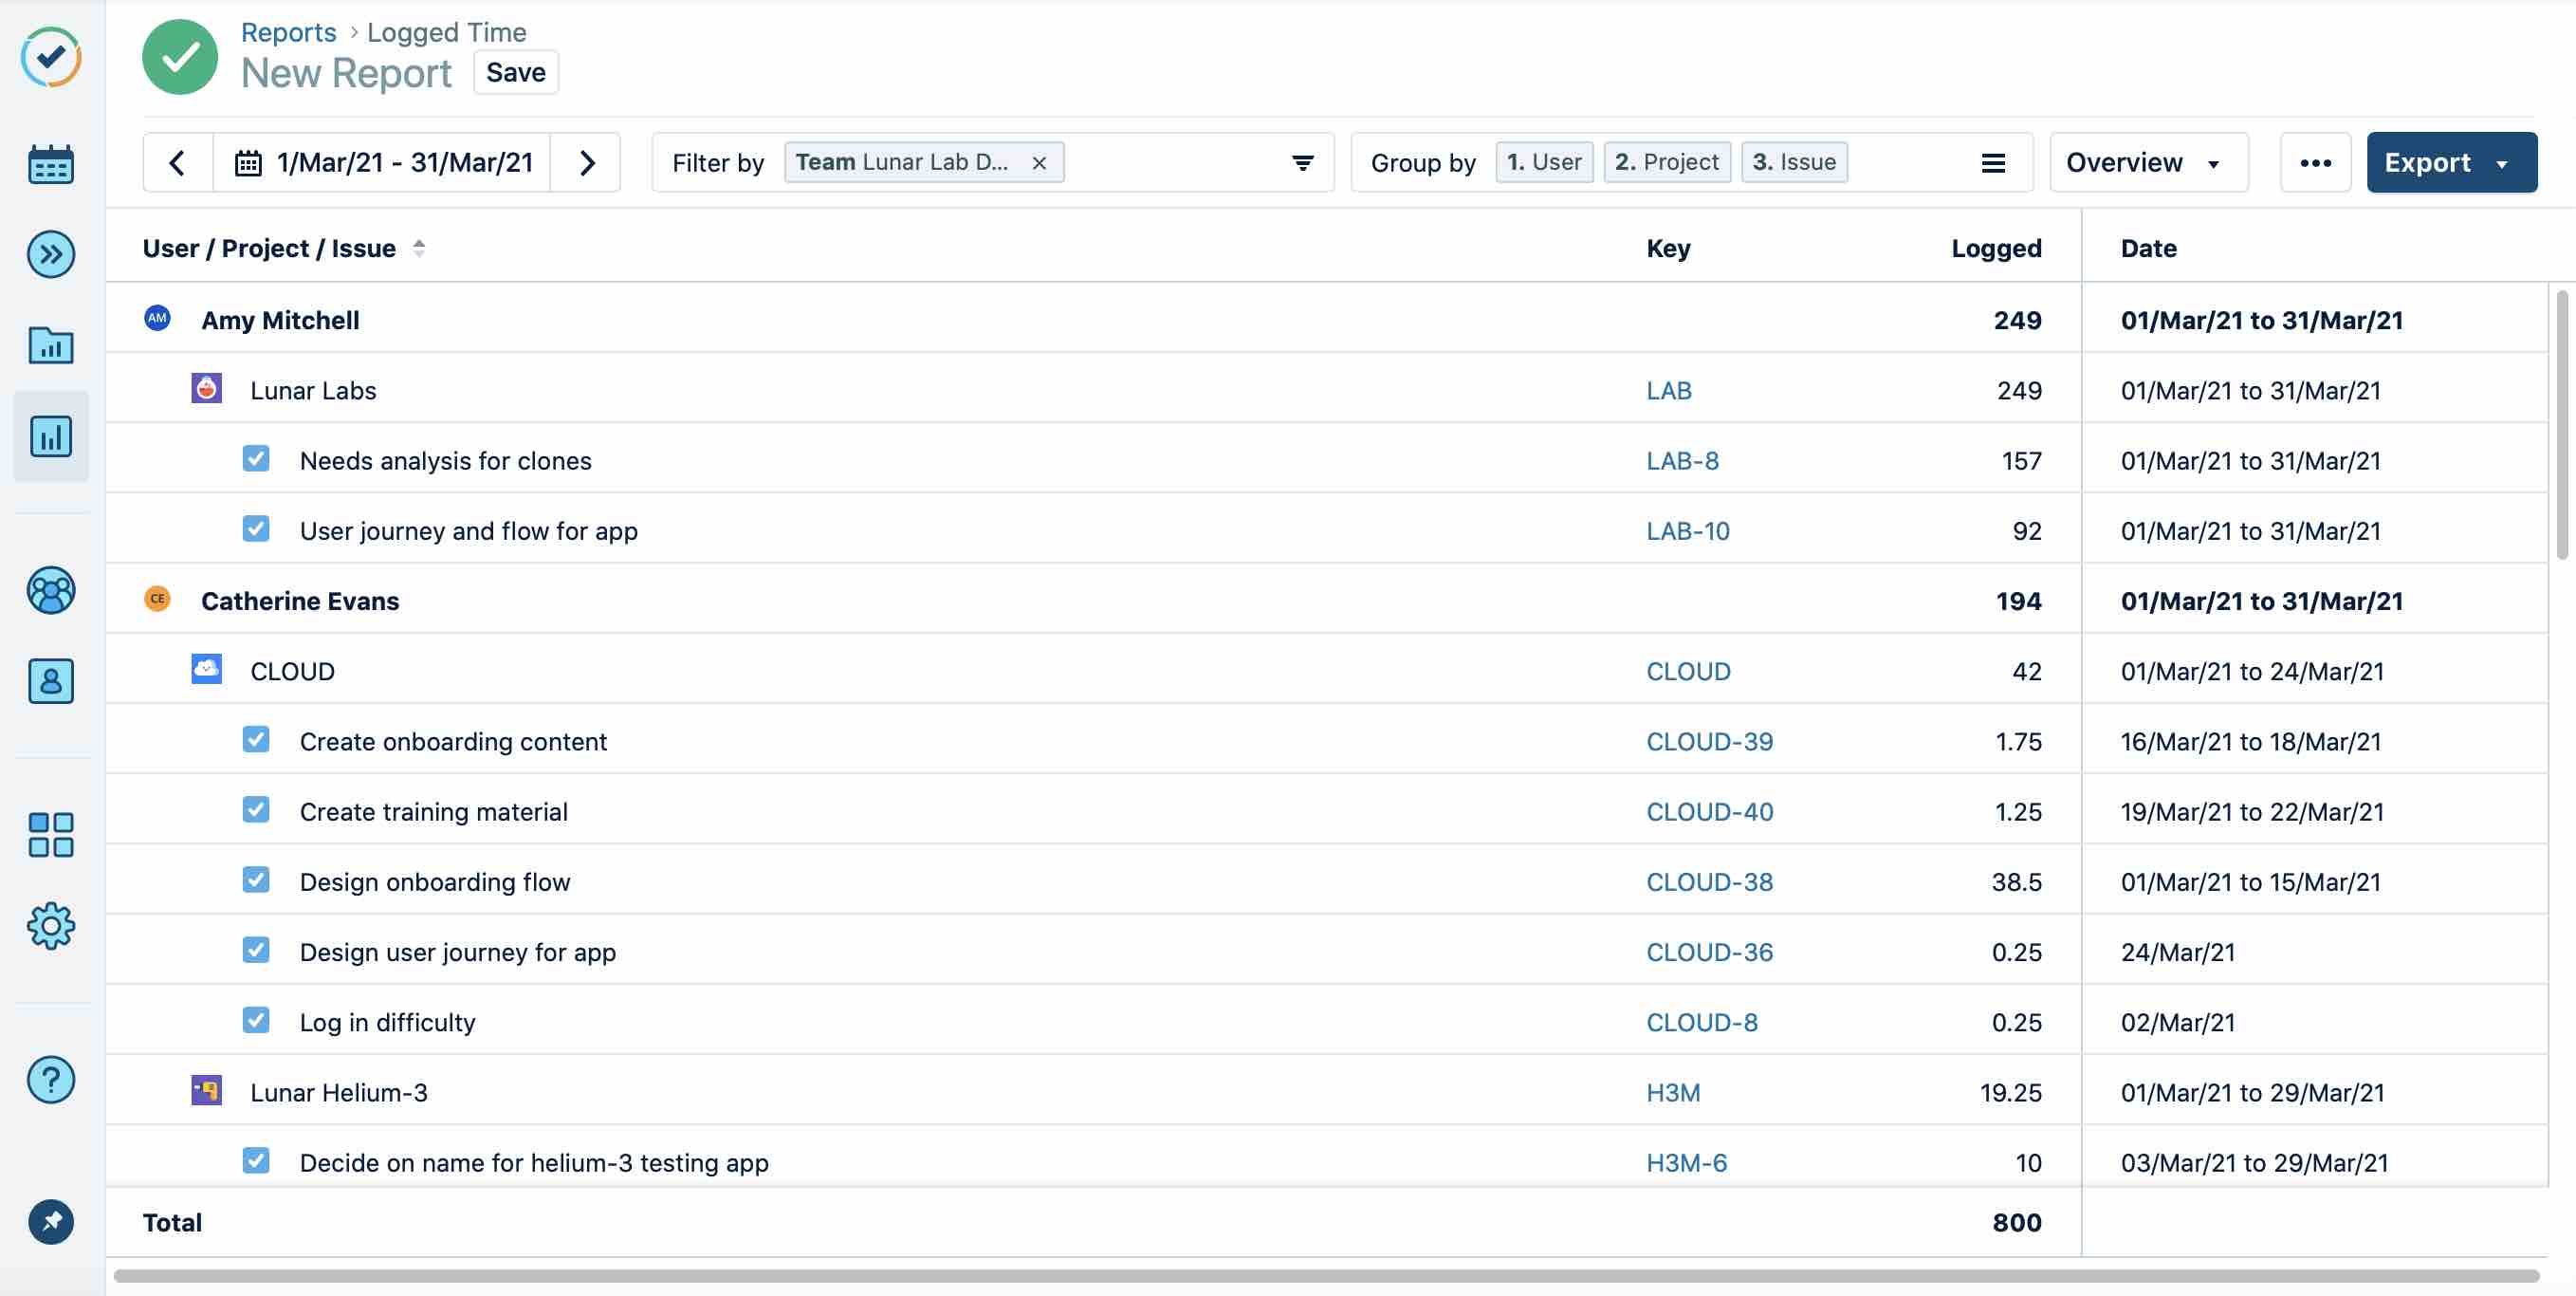
Overview
The Overview option (formerly known as list view) is the default setting for Tempo reports and displays your report as a detailed list in table format. You can choose which attributes or work attributes to show using the Columns and Overview Columns options on the Overview drop-down menu (see below for more info).
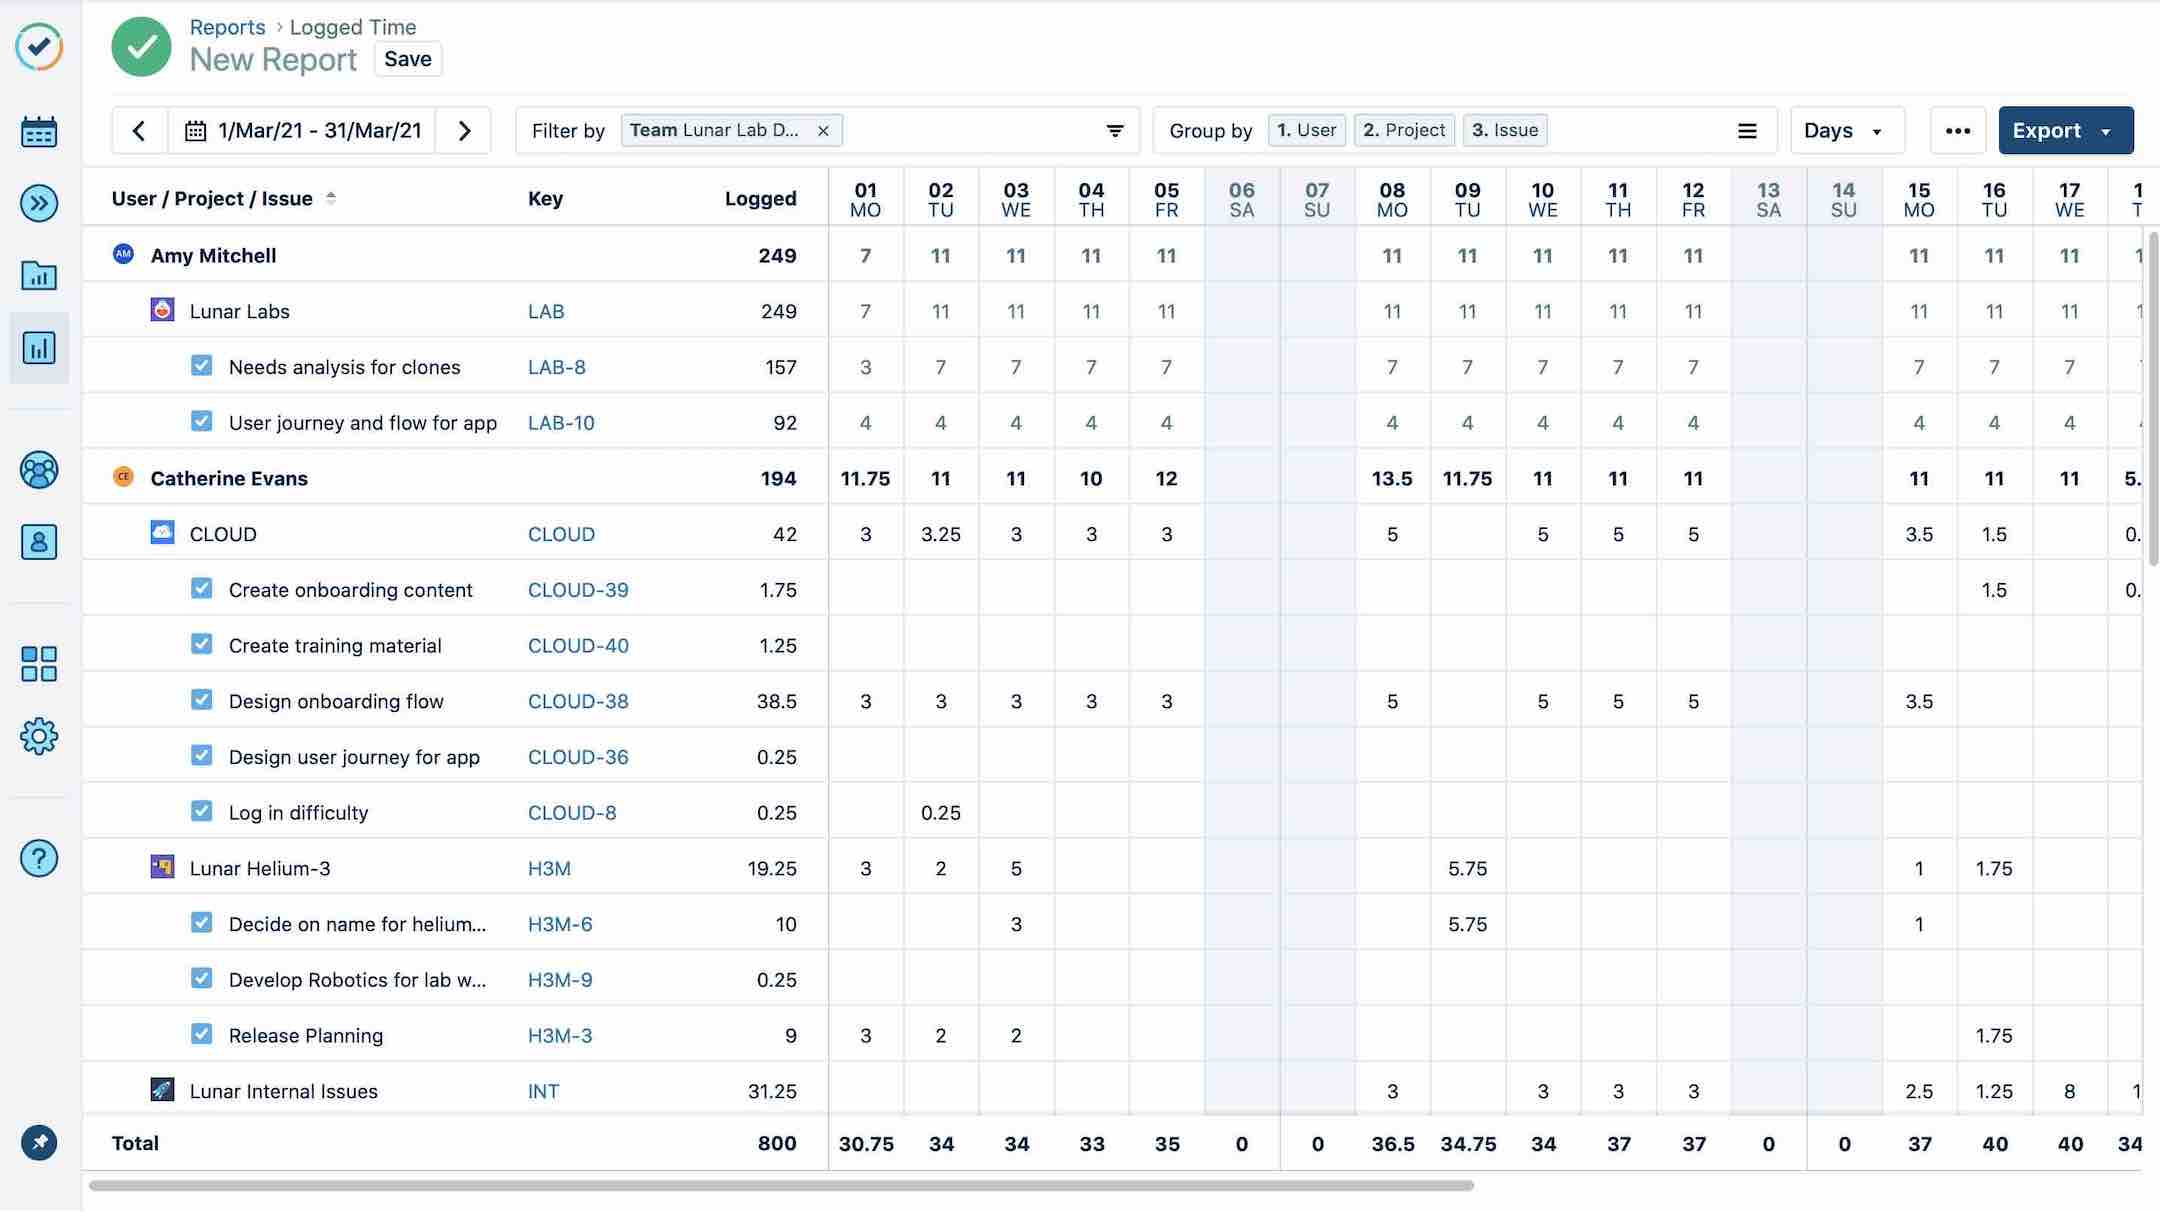
Days, Weeks, Months or Quarters View
The remaining view options -- including days, weeks, months and quarters -- display your report information in a timesheet format (formerly known as grid view). Each column in the grid represents the unit of time that you selected in the drop-down menu.
Once you have selected one of these view options, its name will be displayed in the drop-down button's label.
Tip
In Logged Time reports, you can click the cells and log or edit hours on issues.
Note
If you have the View issue hours permission for the project but not the required permissions to view other users' worklogs, the reports will show you the total number of hours per issue in the project, but not individual worklogs from other users.
Viewing Charts
If you'd like to add visuals to your Logged Time or Planned Time reports -- and get a quick, graphic snapshot of the report's contents -- you can do so by clicking Show Charts in the Overview dropdown menu. (Planned vs. Actual reports display the graphics by default.)
The charts include either horizontal or vertical bar charts that give you a graphic overview of each report's contents. You can easily toggle between the two graphic layouts by using the icons in the right corner.
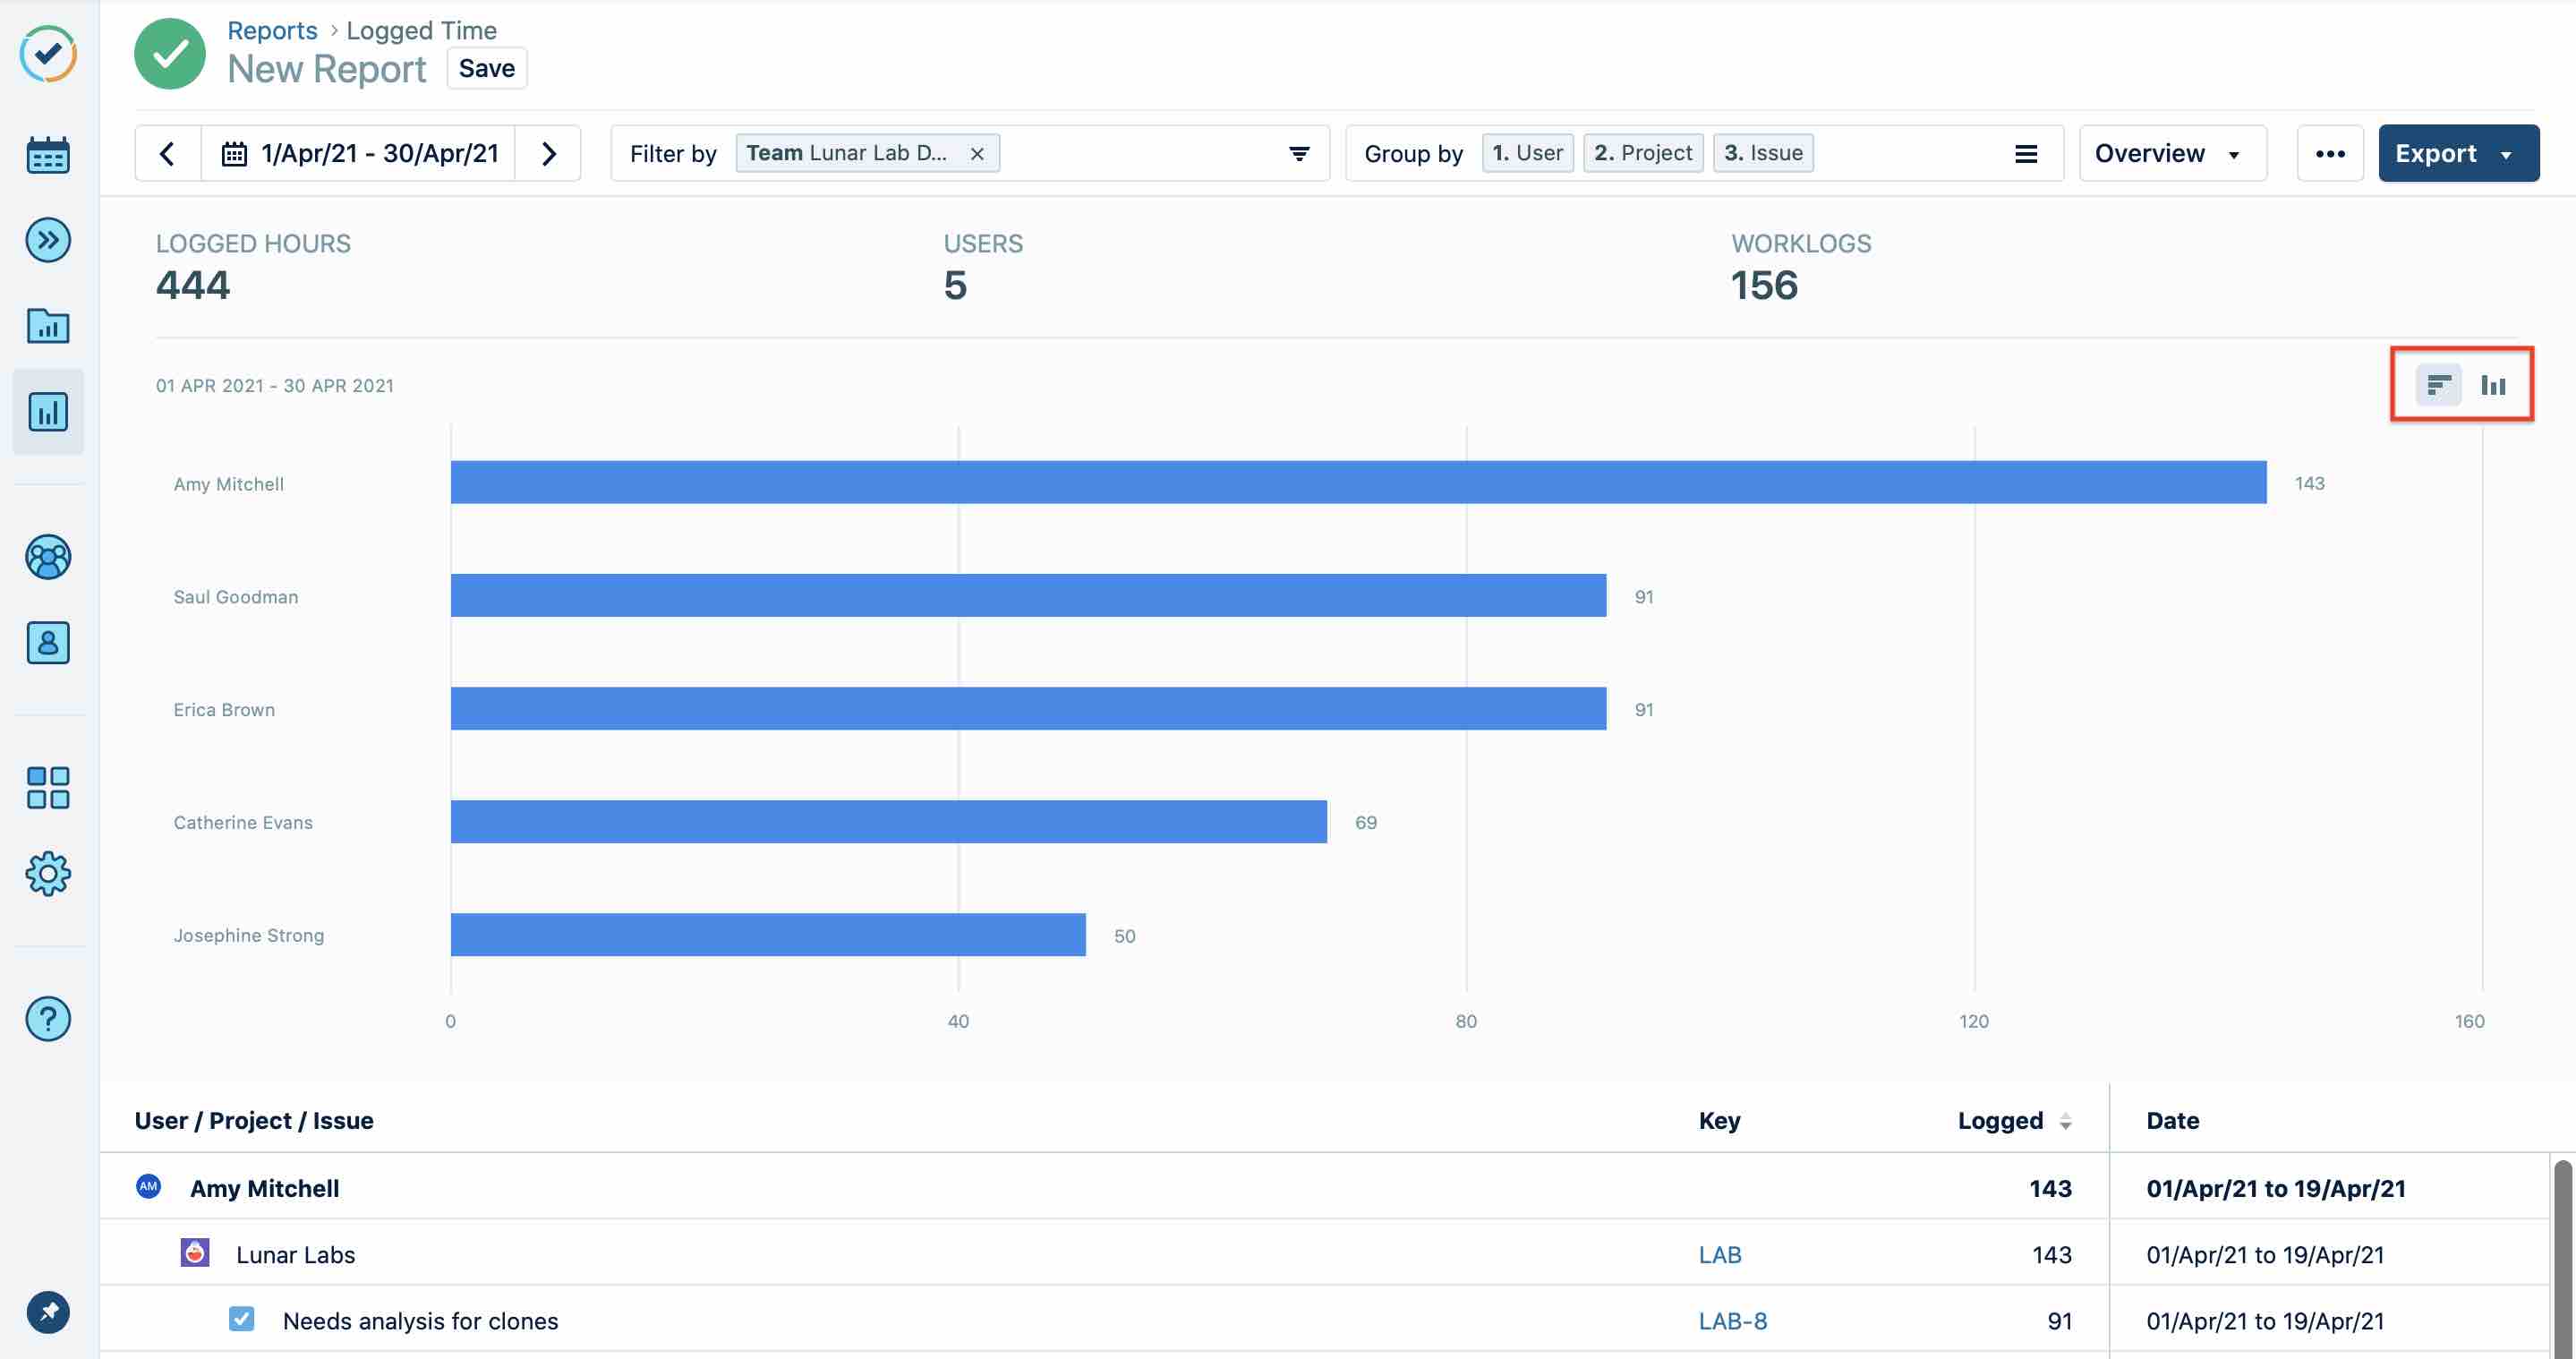
In order to give you quick and easy insights into the reports, the charts include summary statistics in their headers. In the Logged Time report this includes logged hours, users and worklogs. In the Planned Time report this includes planned hours, planned capacity (or utilization), users and plans.
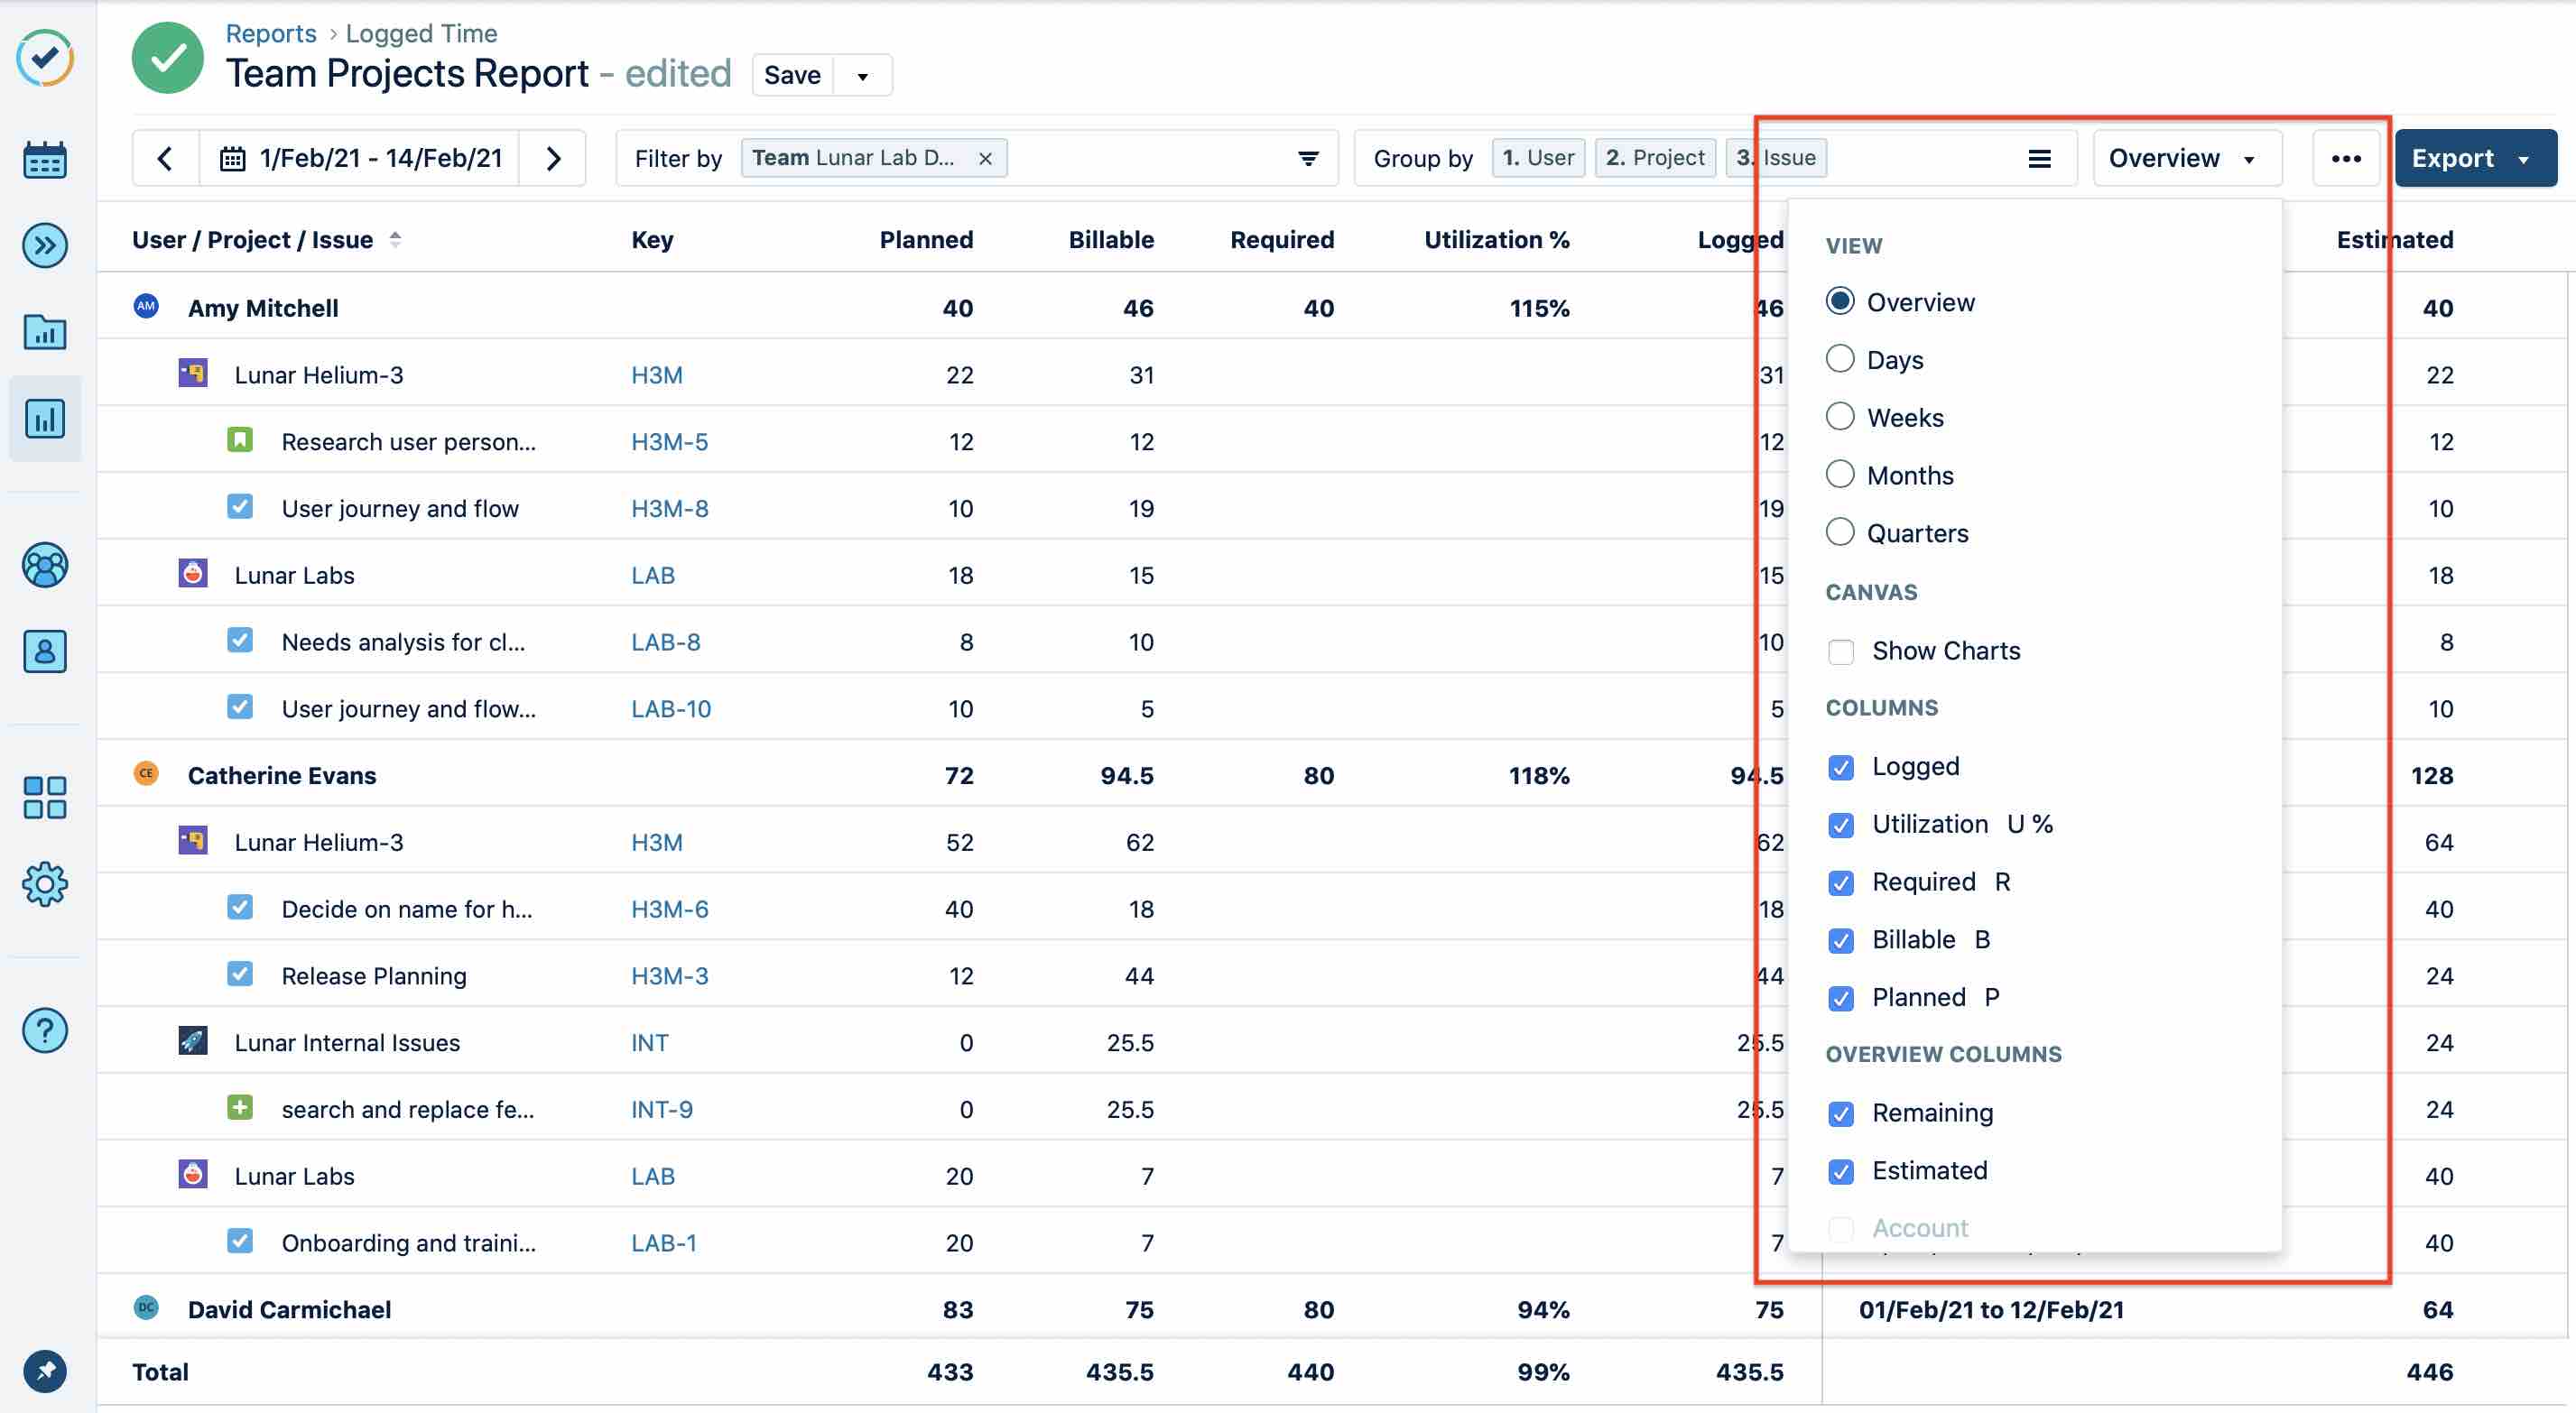
Adding and Removing Columns and Work Attributes
Adding and removing columns or work attributes lets you select what information is displayed in your report and add additional details as needed.
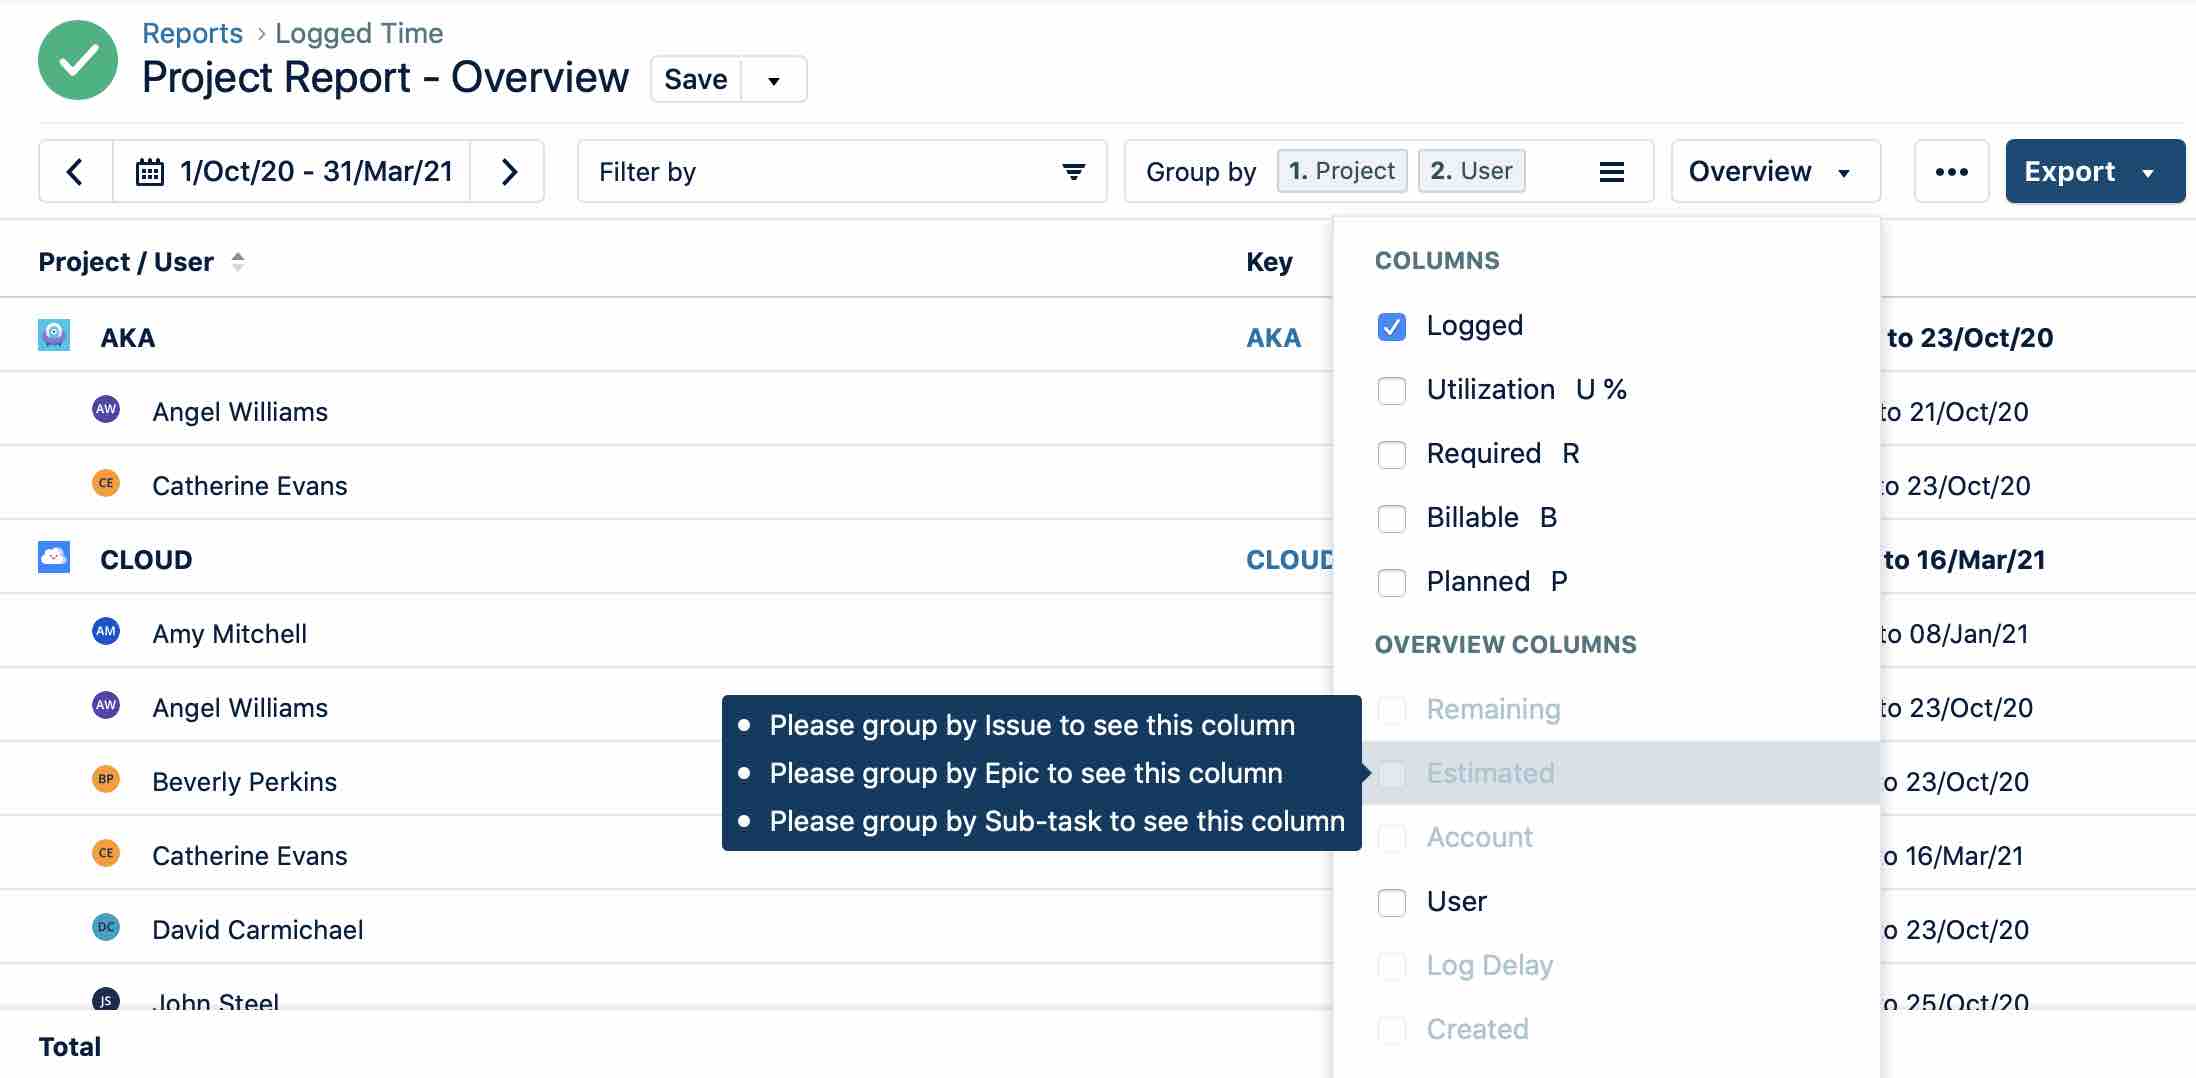
The column options are different for Logged Time vs Planned Time reports, and the columns available depend on how you group your report results. For example, to compare how many billable vs non-billable hours were spent on issues linked to an account, you need to filter the report by Customer and group the information by Account, then add the Billable column.
Tip
You can always hover over unavailable columns to see a tooltip that indicates what fields are required for the column to become available.
Since work attributes are custom fields, the fields displayed in the drop-down menu will vary by organization. You can only display work attributes in the Logged Time report when you select the Overview view and group by Worklog.
To add columns and work attributes:
Click the Overview button at the upper-right.
Select the columns and work attributes you want to show in your report.
To remove a column or a work attribute from the view, clear the checkbox next to its name on the Overview menu.
Below is a list of the various columns you can use to bring additional data into your reports:
Logged Time report | Column | What it does |
|---|---|---|
Columns | Logged | Displays time logged |
Utilization | Displays logged time vs. planned time | |
Required | Displays estimates of how much time is required | |
Billable | Displays time logged in the Billable Hours field in the Log Time form. This column does not include time logged to billable accounts. | |
Planned | Displays time planned | |
Overview Columns | Remaining | Displays estimated hours that are remaining |
Estimated | Displays estimated hours | |
Account | Displays associated account | |
User | Displays user associated with time records | |
Log Delay | Displays the time difference between when you created the time record and the date and time that the the time record was logged to | |
Created | Shows when the time record was created |
Planned Time report | Column | What it does |
|---|---|---|
Columns | Planned | Displays time planned |
Planned Capacity | Shows what percentage of users' time has been planned | |
Required | Displays estimates of how much time is required | |
Overview Columns | User | Displays user associated with plan |
Planned By | Displays who created the plan | |
Status | Shows the status of the planned issue(s) | |
Reviewed By | Displays who reviewed the plan(s) | |
Requested Reviewer | Displays who has been requested to review the plan(s) | |
Status Updated | Shows if the status of the plan has been updated |
Setting Date and Time Formats
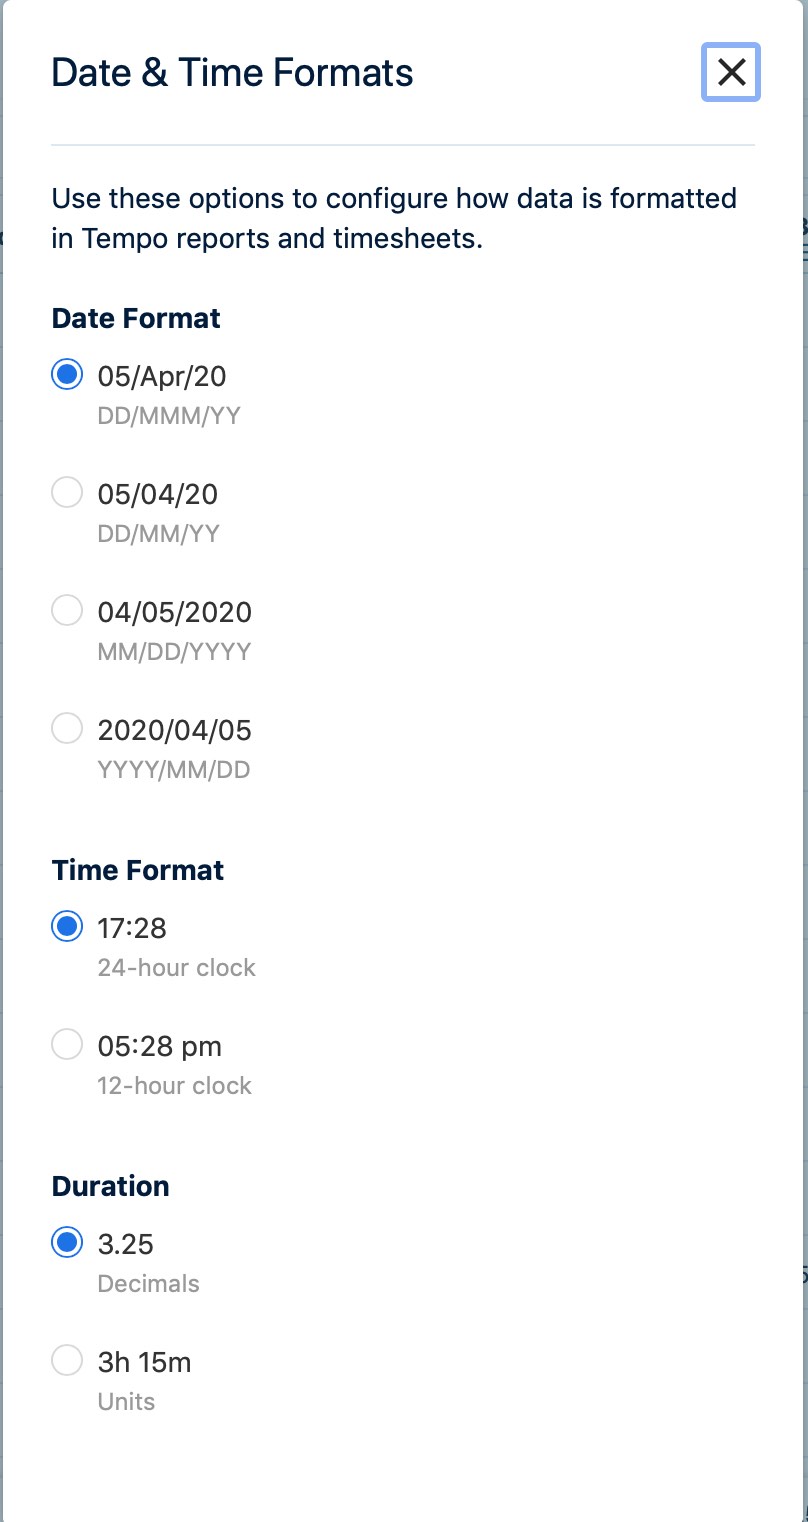
You can select how dates, time, and duration are shown in your reports. Your preferences are applied immediately and are saved on a per user-basis. This affects how the date is displayed in the Date and Created columns in the List view when grouping by worklog, and in the Report Title field when saving.
To change the date, time, and duration format:
Click the ellipsis button  at the top-right, choose Set Date and Time Formats, and select the options you want.