Getting an Overview of Your Project
How to get an overview of your project
Important
To work with Tempo Cost Tracker, you must have Tempo Timesheets installed and have the Tempo Cost Tracker Access global permission.
You can get an immediate overview of how the total cost (labor plus expenses) are tracking towards the budget you set.
Click the Overview tab in the upper-right or select any project from the project list on the Cost Tracker home page to open this page.
Hover over any part of the graph to see a breakdown of your project’s elements up to that date.
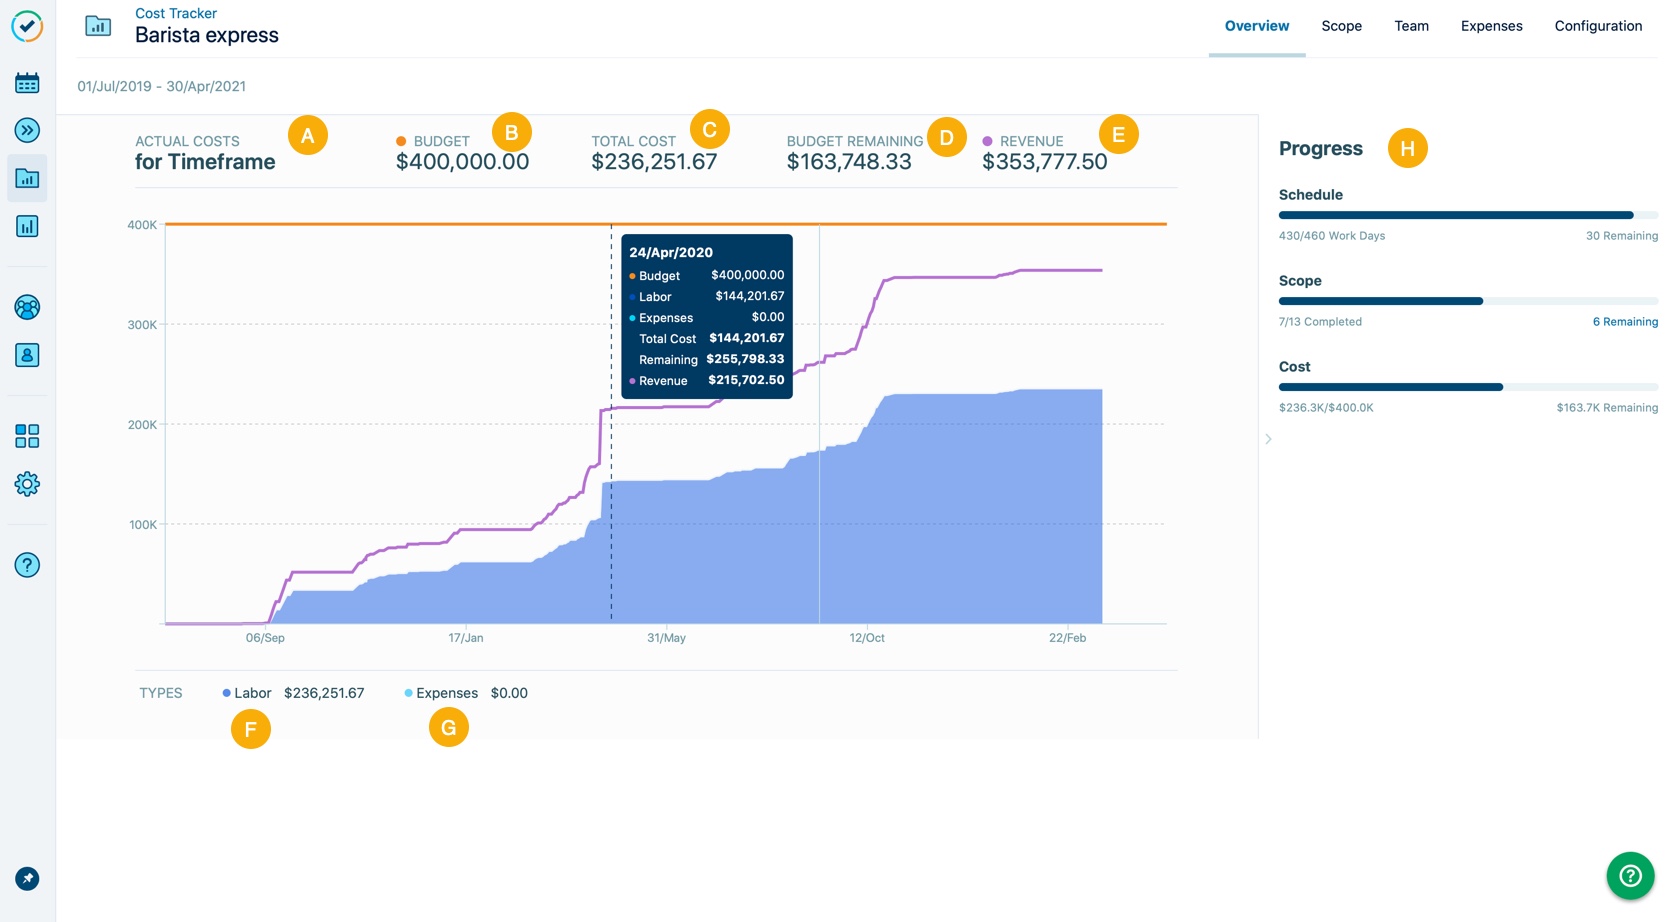
Letter | Element | What is it? |
|---|---|---|
A | The start and end dates of the project are determined either automatically or by a range that you set, shown at the bottom of the graph. The total timeframe is divided by 10. For very short timeframes, dates are shown in single digit increments. | |
B | The amount you have entered on the Configuration page shown as an orange line. If you entered Budget Milestones, they appear as orange “steps”. | |
C | Total Cost | The labor cost plus expenses. |
D | Budget Remaining | The budget minus total cost. |
E | Revenue | This only appears if Revenue tracking is enabled. See for Tracking a project's revenue more. |
F | Labor | The number of hours logged by team members at the Rate you’ve defined shown in dark blue. |
G | The fixed expenses for the project shown in light blue. | |
H | This displays an overview of the project's KPIs. See Viewing a project's progress for more. |
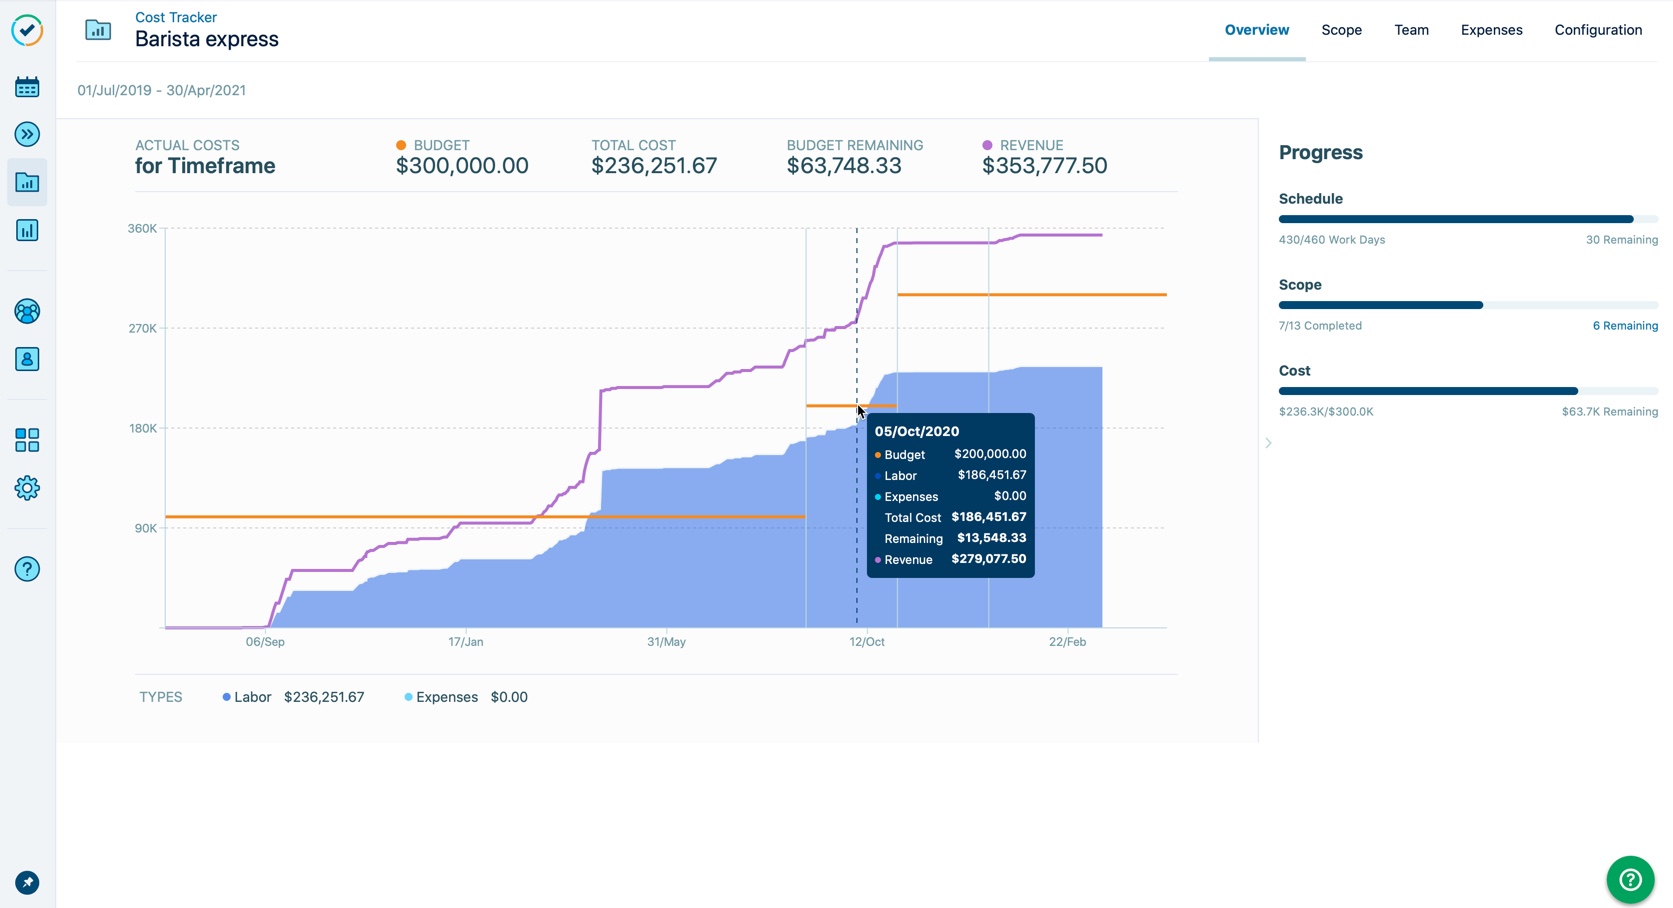
Budget Milestones are shown as orange "steps" over the project's timeframe.
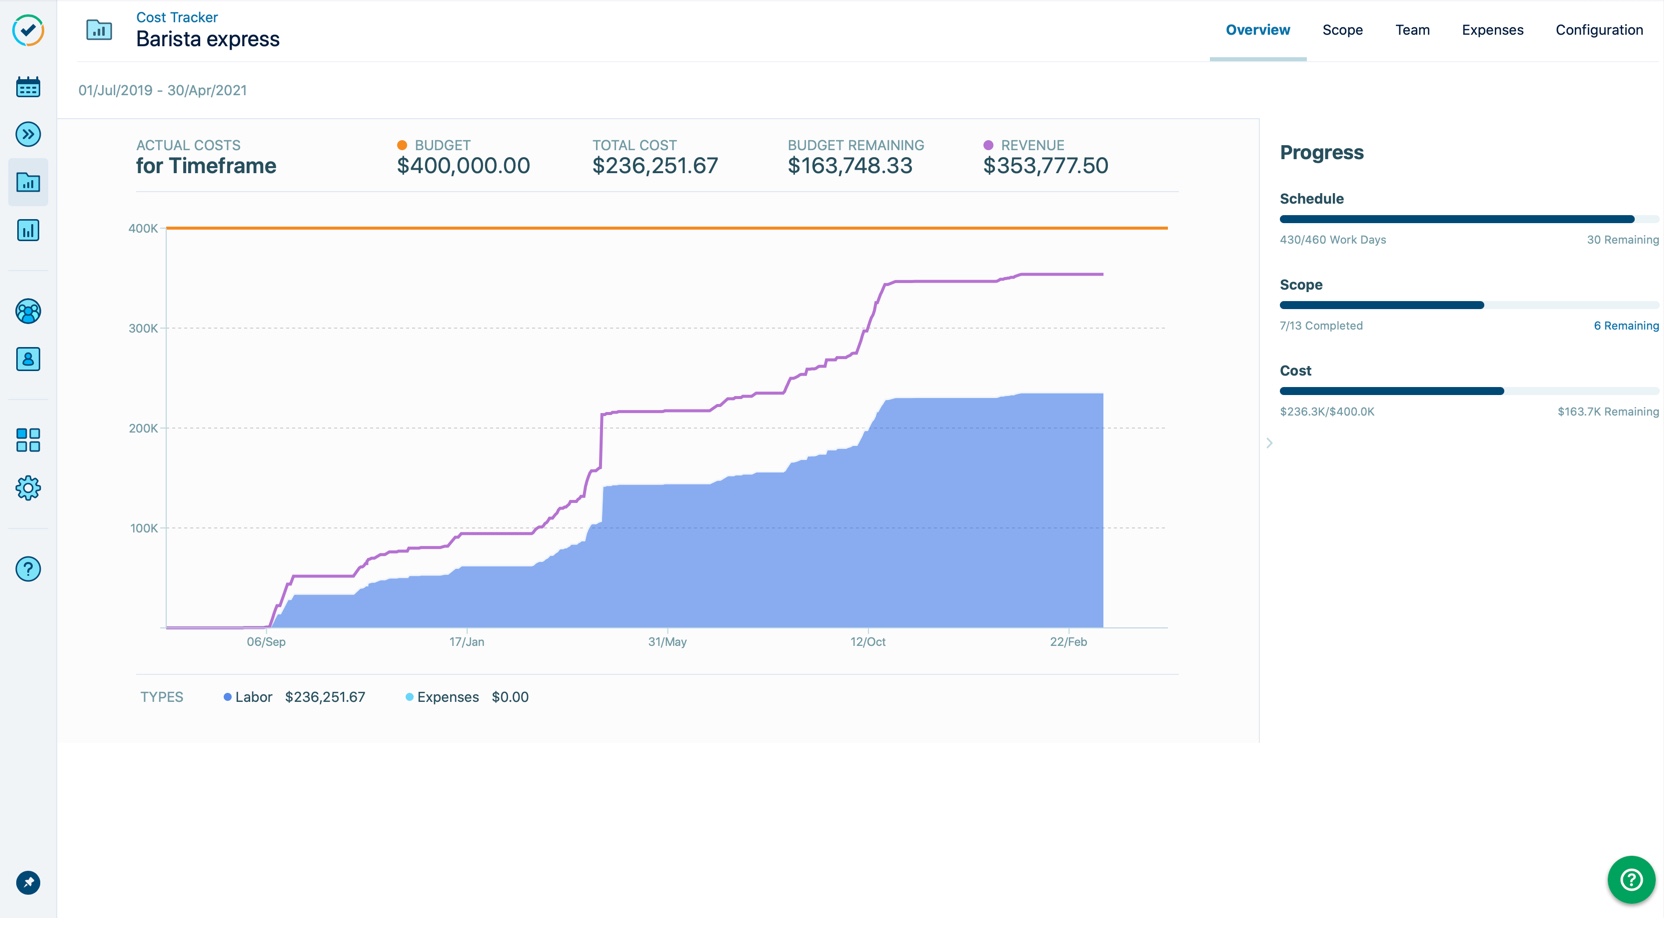
Tracking a project's revenue
If Revenue Tracking is on, you’ll see the revenue generated for your project as a purple line on the graph. Revenue is calculated by multiplying the number of hours logged to a project (the hours that are considered billable) by a Billing Rate - see Tracking a Project's Revenue for more information.
You can compare the Total Cost to Revenue to see the profitability of your project.
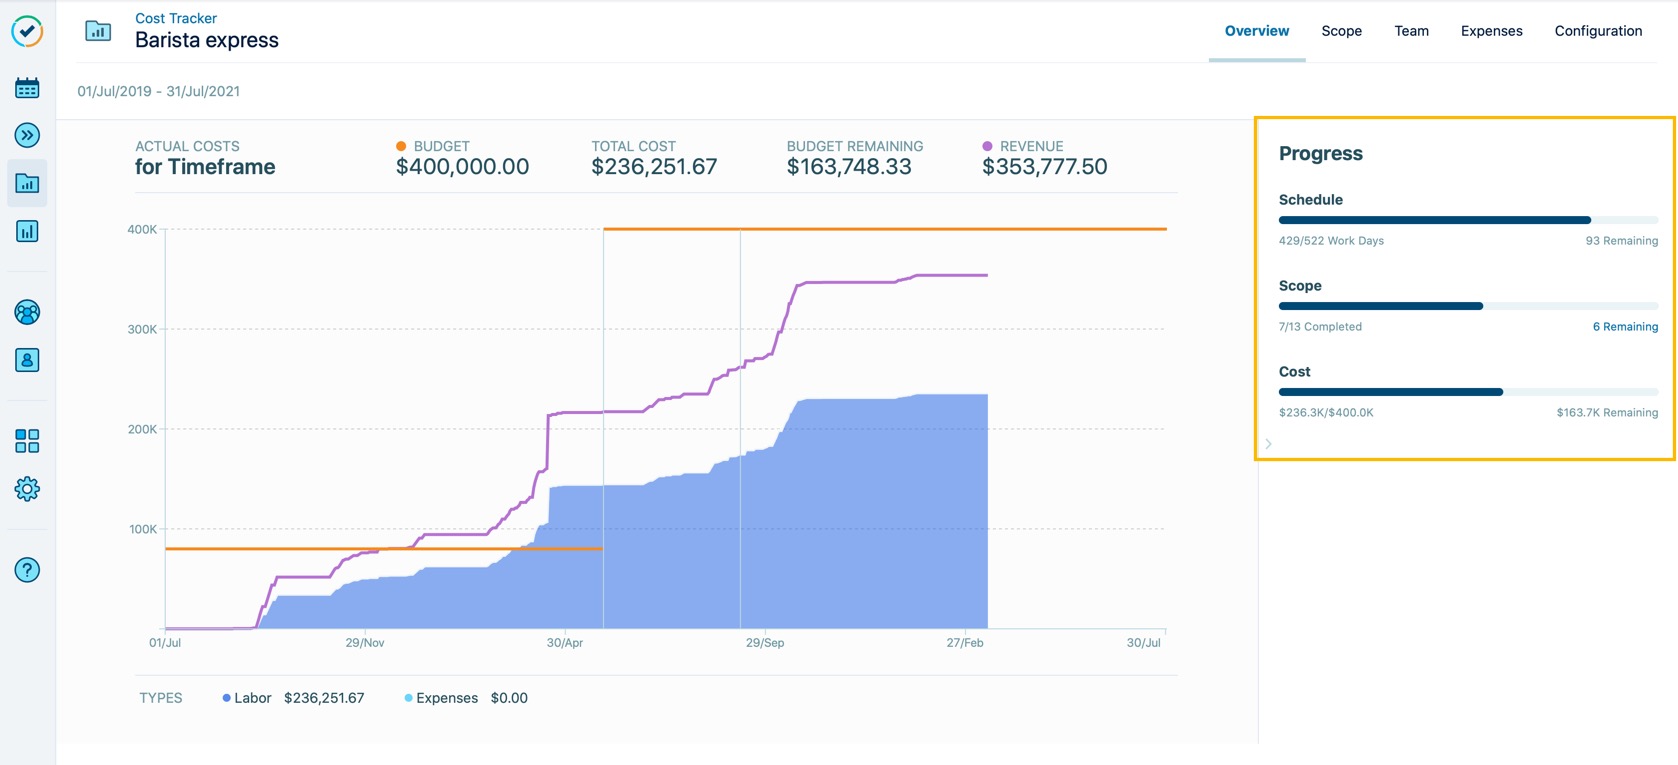
Viewing a project's progress
It's important to know whether your project is on schedule, within budget and how much work there is left to do. You can use the Progress side panel to measure your project's success by monitoring your key performance indicators (KPIs). You can quickly glance at the progress bar for each KPI to gain insight on the status of the project and compare KPIs against each other.
Tip
In the Progress side panel, each KPI's progress bar is stacked on top of each other and can be used to easily compare them.
For example, when a project's Scope is further along than its Schedule, this means that the project is progressing ahead of schedule.
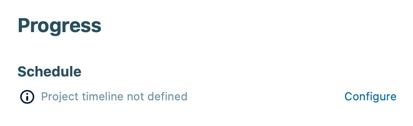
Schedule
The Schedule shows you how you're tracking towards your project deadline and how many working days remain until your project deadline. The working days are based on the holiday and workload schemes defined by Tempo's default holiday and workload schemes. This date is retrieved from the timeframe set for the project in the Configuration page. If no timeframe is defined, then a Schedule progress bar will not be displayed. To learn more about how calculated timeframes work, see Setting the Project's Timeframe.
To set the schedule for a new project, select Configure and select the start and end dates from the date picker. You can go back to the Configuration page to Revert back to a calculated timeframe but you will no longer be able to view anything in the Schedule section.
Scope
The Scope shows you the number of completed tasks and how many are left to be completed in your project. If you want to view the tasks, select "XX remaining" to be redirected to your project's scope page. A completed task is one with a resolution (e.g., Done, Closed). To learn more about resolutions, go here.
To set the scope for a new project, select Set Scope and select the Jira filter you want to use for the project. This will import the tasks and time records associated to the Jira filter.
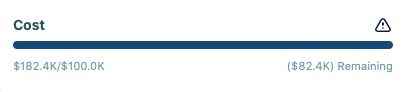
Cost
The Cost shows you the actual cost, total budget and how much of your budget remains for your project. The actual cost is the sum of the labor costs (based on time records) and expenses.
To set a budget for a new project, select Configure and enter the budget in the Configuration page.
If you are over your budget, then an attention icon will appear and you'll be able to see the amount you are above your budget by.
For example, this project is above its budget by $82.4K:
Tip
By default, the Progress side panel will always appear on the right side of the Cost Tracker project overview screen. If you want to hide the Progress side panel, you can collapse it and Cost Tracker will remember your preference for that specific project on that browser. You can reopen it at any time using the side arrow.